
File:US Manufacturing charts v1.png
Size of this preview: 800 × 439 pixels. Other resolutions: 320 × 176 pixels | 640 × 351 pixels | 1,353 × 743 pixels.
Original file (1,353 × 743 pixels, file size: 259 KB, MIME type: image/png)
| This is a file from the Wikimedia Commons. Information from its description page there is shown below. Commons is a freely licensed media file repository. You can help. |
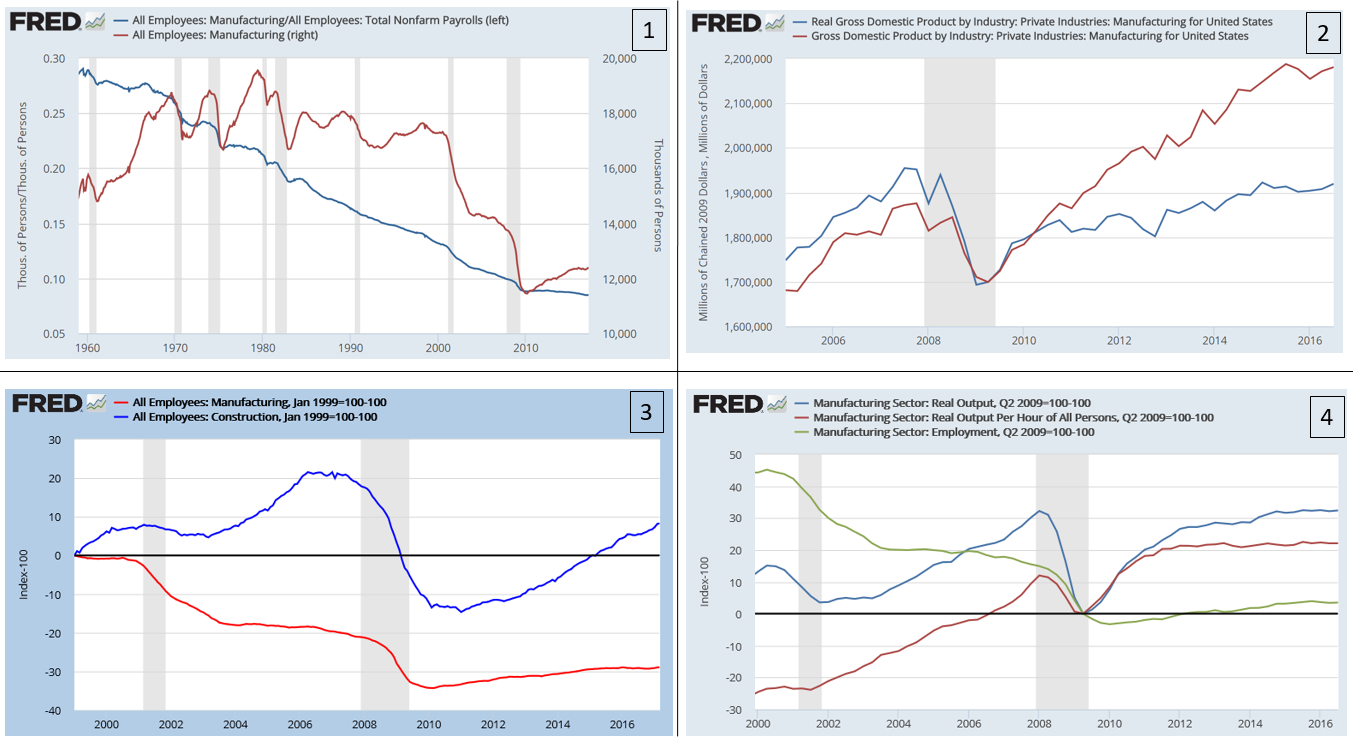
Understanding the chart
- Figure 1-Job measures: The blue line /left axis is the ratio of manufacturing jobs to the total number of non-farm payroll jobs. It has declined since the 1960s as manufacturing jobs fell and services expanded. The Red line/right axis is the number of manufacturing jobs (000s), which had fallen by nearly one-third since the late 1990s.[1]
- Figure 2-Output measures: Real (inflation adjusted) GDP (blue line) and Nominal GDP (red line) from the manufacturing sector. While both rose from the trough due to the Great Recession, the real GDP had yet to regain its pre-crisis (2007) level as of 2016.[2]
- Figure 3-Job measures, indexed: The red line shows the percent change in manufacturing jobs, measured relative to the 1999 as the starting point. The blue line shows construction jobs. Both were below pre-crisis levels in 2016.[3]
- Figure 4-Productivity measures, indexed: Measured from the end of the recession (June 2009), employment (green line) is up about 5%, but real output is up over 30%, indicating a significant gain in productivity (i.e., output per labor hour).[4]
Reflist
Summary
| Description |
English: Panel showing four manufacturing charts |
| Date | |
| Source |
Federal Reserve Economic Data (FRED)
|
| Author | FRED, U.S. Bureau of Labor Statistics, U.S. Bureau of Economic Analysis |
Licensing
| This chart is ineligible for copyright and therefore in the public domain, because it consists entirely of information that is common property and contains no original authorship. For more information, see Commons:Threshold of originality § Charts
|
File history
Click on a date/time to view the file as it appeared at that time.
| Date/Time | Thumbnail | Dimensions | User | Comment | |
|---|---|---|---|---|---|
| current | 00:41, 19 April 2017 | | 1,353 × 743 (259 KB) | Farcaster | User created page with UploadWizard |
File usage
The following page uses this file: