
File:MALS PS Mis 3DPlot MacAstra.jpg
No higher resolution available.
MALS_PS_Mis_3DPlot_MacAstra.jpg (747 × 468 pixels, file size: 308 KB, MIME type: image/jpeg)
| This is a file from the Wikimedia Commons. Information from its description page there is shown below. Commons is a freely licensed media file repository. You can help. |

|
This graph image could be re-created using vector graphics as an SVG file. This has several advantages; see Commons:Media for cleanup for more information. If an SVG form of this image is available, please upload it and afterwards replace this template with
{{vector version available|new image name}}.It is recommended to name the SVG file “MALS PS Mis 3DPlot MacAstra.svg”—then the template Vector version available (or Vva) does not need the new image name parameter. |


Summary
| Description |
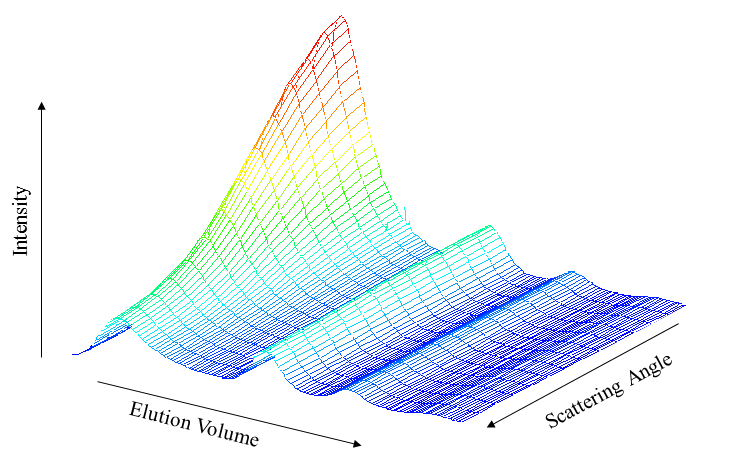
English: This graph shows a separated sample mix polystyrene spheres of various sizes and the light scattering intensity from each separated sample showing the angular variation based on size of the spheres. |
| Date | |
| Source | Wyatt Technology Corporation |
| Author | Wyatt Technology Corporation |
- Other information
English: This illustration could have been created by anyone performing a chromatographic separation of PS spheres, and plotting them using the 3D plot available in MacAstra by Wyatt Technology Corproation c. 1995
Licensing
| This work is ineligible for copyright and therefore in the public domain because it consists entirely of information that is common property and contains no original authorship. |
File history
Click on a date/time to view the file as it appeared at that time.
| Date/Time | Thumbnail | Dimensions | User | Comment | |
|---|---|---|---|---|---|
| current | 20:49, 24 March 2017 | | 747 × 468 (308 KB) | 4LegsGood | {{subst:Upload marker added by en.wp UW}} {{Information |Description = {{en|This graph shows a separated sample mix polystyrene spheres of various sizes and the light scattering intensity from each separated sample showing the angular variation based o... |
File usage
The following page uses this file: